Error reduction
The error reduction is the percentage of tracking error (open loop) that is reduced by the guiding algorithm.
This calculation is based to the rms errors and therefore takes some time to settle.
It is computed as:
((tracking_error - guiding_error) / tracking_error) * 100 [%]
Where
Tracking_error = open loop error:
This is the error that would happen if auto-guiding is not in effect, known as the open loop error, the one which is expected to be corrected by the auto-guiding. It is automatically computed by SkyGuide regardless of the auto-guiding status (active guiding or not, and any aggressiveness values). This means that one can see and compare his open error with the closed loop error resulting of auto-guiding and supposed to be smaller.
Guiding_error = closed loop error:
This is the "classical" closed loop error resulting of auto-guiding usually display by all auto-guiding software.
The error reduction is very helpfully to determine whether or not auto-guiding is working as it should.
A negative error reduction means that auto-guiding is WORST than not guiding, at least from a noise point of view (drift not considered).
This is usually related to short guider exposure and/or large aggressiveness values, chasing the seeing, or some loop instability.
Consider increasing the guider exposure time and lowering the aggressiveness values. You could use our optical guiding calculator as a starting. point.
There is a very common but usually wrong assumption that if the auto-guiding error (closed loop) is as small as possible then auto-guiding is successful.
However under seeing limited conditions (and other noise sources) one should expect that the closed loop (auto-guiding) error settles to a minimum value related to the irreducible noise and seeing effects, a lower values would means that one "chase" the seeing and noise.
In short aiming to make the closed loop error as small as possible is not the right goal and figure of merit, one should instead compare both the opened and close loop errors to make any quantitative conclusions.
This is what the reduction is providing.
One should look at it long term behavior rather than any short term fluctuation since we are, by nature, dealing with noise an rms averaged values.
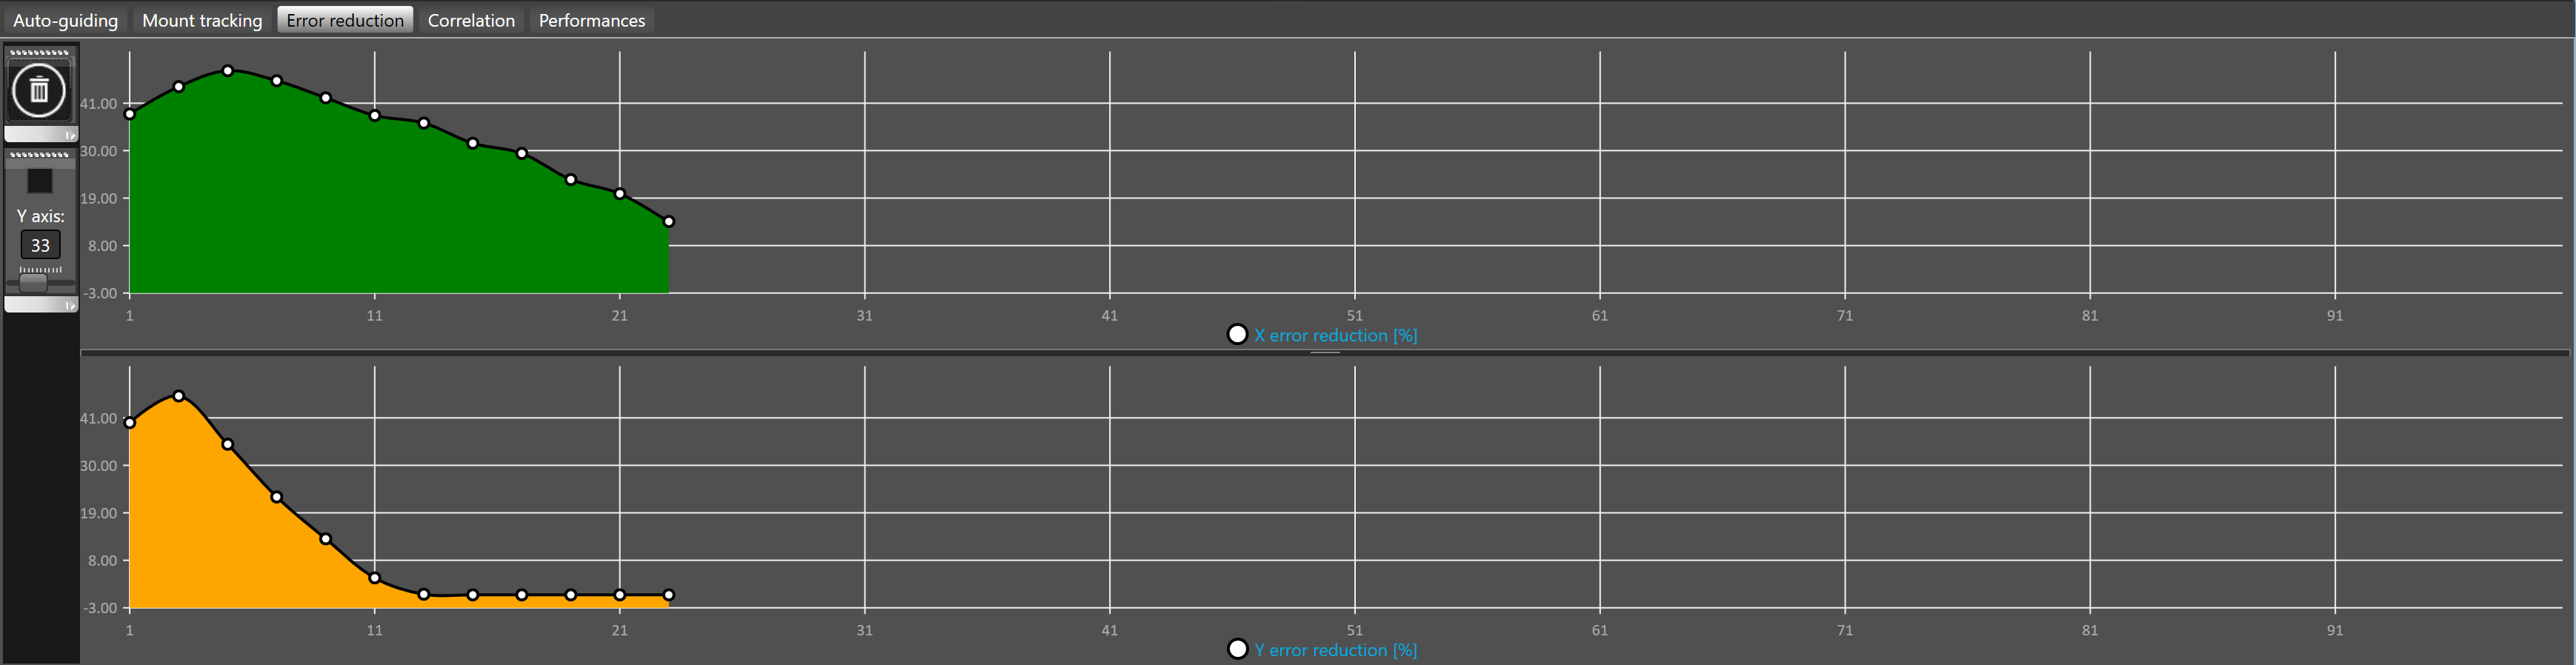
This plot shows the history of the error reduction for both axis X and Y.
By default, the number of iterations displayed in the graph is 50.
To change the plot history length, see advanced settings.
The error reduction is displayed in black.
 The area below the curve shows the current error reduction efficiency in color:
Red: Counterproductive - The closed loop error is in average significantly worse the the open loop error (check/change your guider exposure time and aggressiveness values).
Orange: No significant reduction - The closed loop error is in average not much different than the open loop error.
Green: Good auto-guiding - The closed loop error is significant better than the opened loop error..
 Plots are cleared when guiding is started. You can manually clear the plots with the
 ![]() button.
button.
To record the history into a file that can be later on used for analysis, SKG allows to write all Information into a Comma Separated File. Output to CSV can be enabled/disabled while guiding at any time.
By default the scale of the Y axis is automatically adjusted to fit the values displayed in the plots but sometimes to ease the reading it could be good to use a fixed scale.
The vertical toolbar allows to define how the Y axis will be displayed:
The check box allows to fix use the value displayed under Y axis label as a fixed scale.
To change the Y axis scale you must use the slider bellow the Y axis label.