Focusing
![]() Not available nor applicable with SkyGuide
Not available nor applicable with SkyGuide
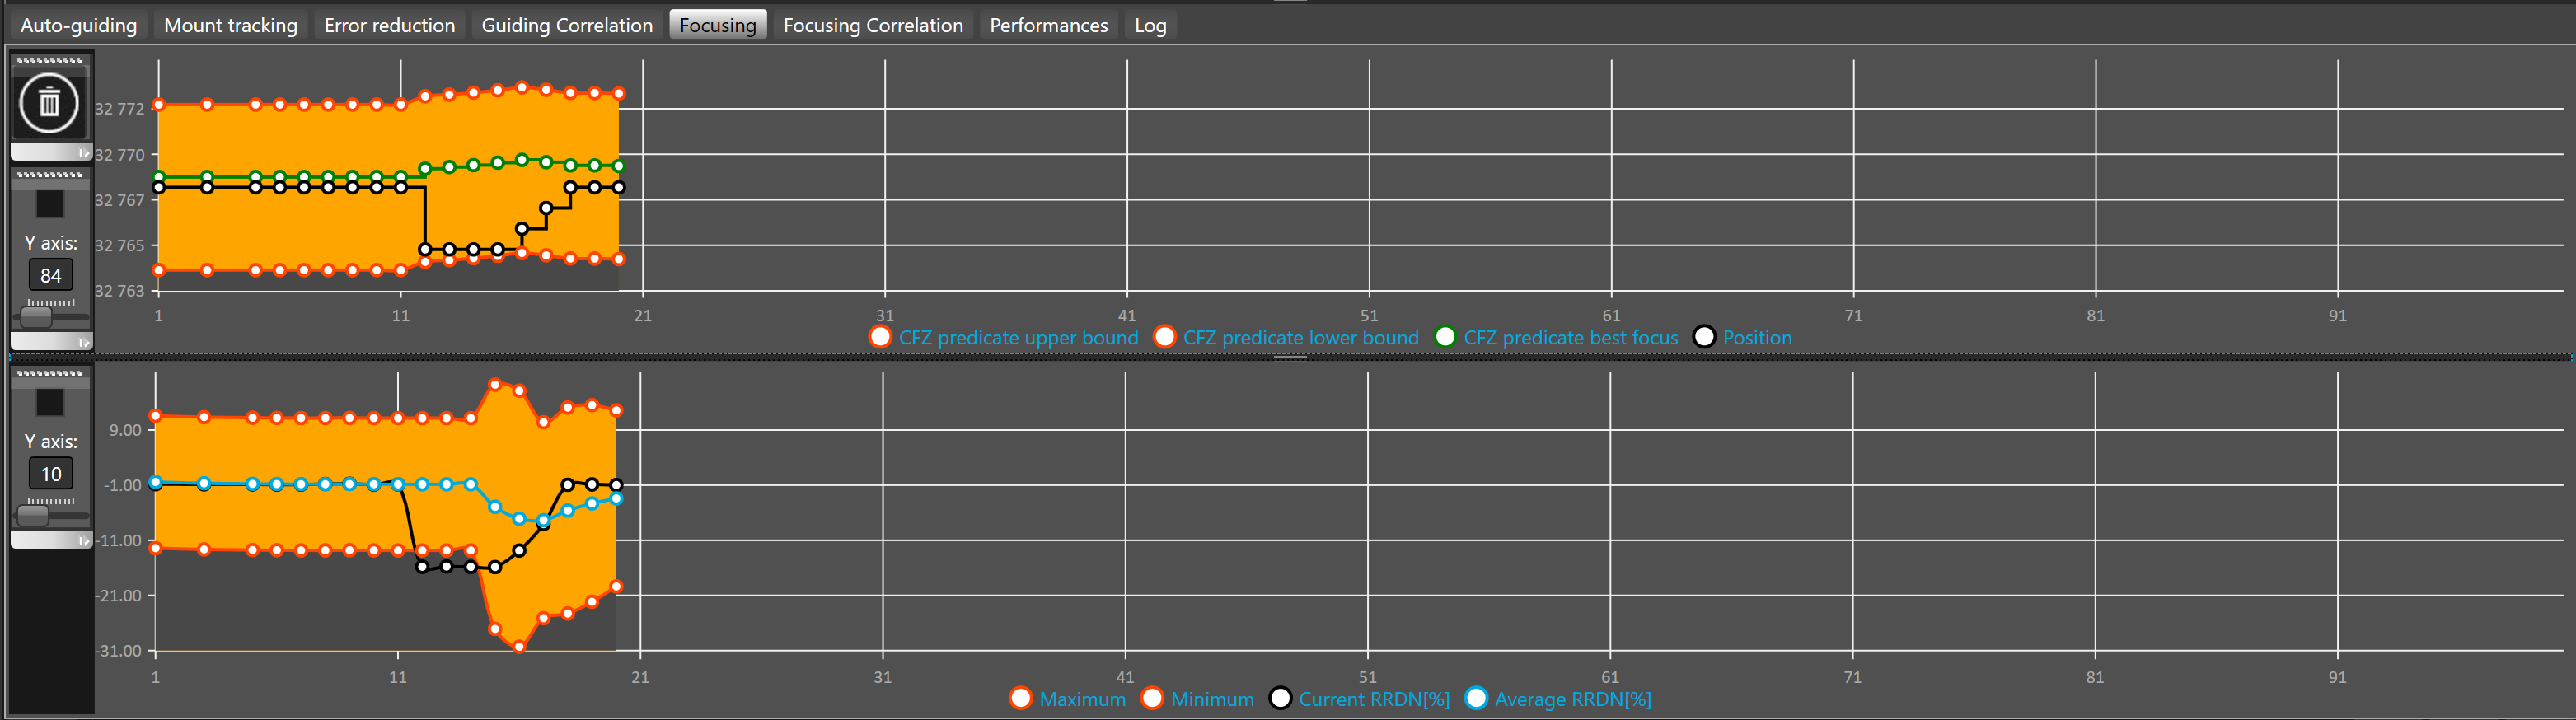
This plot shows the history of the auto-focusing errors.
The upper plot shows the focuser position is steps, the lower plot shows the measure of astigmatism as a percentage of the relative roundness.
By default, the number of iterations displayed in the graph is 50.
To change the plot history length, see advanced settings.
In the upper plot, the black curve shows the evolution of the focuser position is steps, the green curves shows the predicate for the best focus and the red curves shows the boundaries of the critical focus zone (CFZ) predicate.
 When the black curve is between the two red curves (CFZ area) your instrument is focused, otherwise it is intra or extra focal.
In the lower plot, the black curve shows the current relative roundness in percent, the blue curve shows the average relative roundness in percent and the red curves shows the boundaries of the error protection envelope.
 To suspend focusing when the current relative roundness is going outside the error protection window enable error protection in advanced settings.
Plots are cleared when guiding is started. You can manually clear the plots with the ![]() button.
button.
To record the history into a file that can be later on used for analysis, SKG allows writing all Information into a Comma Separated File (CSV). Output to CSV can be enabled/disabled while focusing at any time.
By default the scale of the Y axis is automatically adjusted to fit the values displayed in the plots but sometimes to ease the reading it could be good to use a fixed scale.
The vertical toolbar allows to define how the Y axis will be displayed:
The upper check box allows to fix use the value displayed under Y axis label as a fixed scale.
To change the Y axis scale you must use the slider bellow the Y axis label.
There is one Y axis toolbar per plot, both plots can be adjusted differently.